
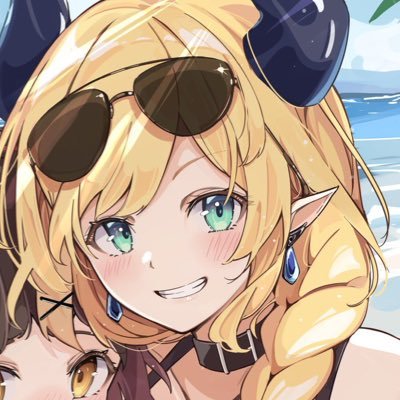
癒月ちょこ💋@ホロライブ
新人Vtuberのホロライブ2期生、悪魔のバーチャル保健医癒月ちょこ(ゆづきちょこ)と申します! チョコのような甘くとろけるような癒しのひとときをあなたに ファンアート【 #しょこらーと】※描いて頂いた絵は活動に使用させて頂くことがあります。 母上様:桝石きのと様@shima_je
842,032
Followers
1,982
Following
29,009
Tweets
2,556.4
Avg Engagement
11,082
Listed
No
Verified
Account Overview
What This Report Covers
This comprehensive analysis examines @yuzukichococh's Twitter/X presence across multiple dimensions. We analyze tweet content, engagement patterns, audience demographics, posting habits, and network connections to provide actionable insights about this account's social media strategy and influence.
Account Classification
- Account Size: Macro Influencer (100K+)
- Account Age:2018-08-02
- Verification:No
- Location:魔界学校
Data Summary
- Tweets Analyzed:3,248
- Avg Likes per Tweet:1,979.1
- Avg Retweets per Tweet:577.3
- Followers Analyzed:50,000
Engagement Analysis
Based on 3,248 tweetsHer tweets typically receive a high number of likes and retweets, indicating strong audience interaction. She also encourages fan art submissions, which increases community involvement.
1,979.1
Avg Likes/Tweet
577.3
Avg Retweets/Tweet
6,428,145
Total Likes
1,875,019
Total Retweets
Engagement Quality Analysis
Median-based metrics that resist fake virality and outliers.
1,516
Median Likes
216
Median Retweets
3,528
75th Percentile
205,414
Top Tweet
3.04
Engagement per 1K Followers
Normalized influence metric
Long Tail
Engagement Pattern
Mix of hits and regular posts
Posting Behavior
Content style and format preferences
Mixed
Balanced content approach
48.9%
Original
17.5%
Replies
29.0%
Retweets
4.6%
Quotes
0.0%
Threads
0.0%
With Media
48.2%
With Links
32.9%
With #Tags
52.8%
With @Mentions
32.5%
With Emojis
60
Avg Length
Audience Reaction Profile
Interactive
Balances broadcasting with conversation
0.36
Reply/Original Ratio
0.16
Quote/RT Ratio
Posting Rhythm
Highly Bursty
Posts in concentrated bursts
74.7%
Weekday Posts
25.3%
Weekend Posts
Top Hashtags
Most Mentioned
Want This Report as PDF?
We're building PDF export for these analytics reports. Register your interest to get early access.
Content Strategy Analysis
Based on 3,248 tweetsContent Type Distribution
Content Breakdown
What This Reveals About Their Strategy
This is a content-creator focused account that primarily shares original thoughts, ideas, and media. With original content dominating their feed, they position themselves as a source of new information rather than a curator. This strategy works well for establishing thought leadership.
The 942 retweets (29% of activity) show they also amplify content from others, which helps build relationships with other accounts and provides value to followers by surfacing relevant content.
Posting Patterns & Optimal Timing
Based on 3,248 tweetsEngagement by Hour (UTC)
Posting Frequency Over Time
Timing Insights
Understanding when an account posts and when their audience is most responsive provides valuable competitive intelligence. The charts above show when this account's content receives the most engagement, which often correlates with when their specific audience is most active on the platform.
Peak posting times vary significantly based on an account's audience demographics, timezone distribution, and content type. Accounts with global audiences often see engagement spread across multiple time windows, while those with regional focus may have more concentrated peaks.
Audience Demographics
Based on 50,000 followersHer audience primarily consists of fans of VTubers and anime enthusiasts. They are likely interested in interactive and entertaining content.
Average
Audience Quality
30.4%
Suspicion Index
40.2%
Low-Quality %
4
Median Reach
Audience Quality Signals
Lower percentages indicate healthier, more authentic followers.
46.7%
Empty Bio
43.9%
<10 Tweets
2.6%
Mass Following (>2K)
0.0%
New (<90 days)
69.0%
Low Ratio (<0.1)
0.0%
New (<180 days)
94.6%
No URL
33.6%
<3 Tweets
Free Mode Analysis: These quality metrics use heuristic signals (empty bios, low tweets, suspicious ratios). For ML-powered bot detection with 95%+ accuracy, use our dedicated tool.
Try Bot DetectorFollower Reach & Influence
This account's followers have their own audiences, creating potential for secondary amplification.
10,703,821
Total Potential Reach
4
Median Follower Reach
35
75th Percentile Reach
1.9%
>1K followers
0.1%
>10K followers
0.0%
>50K followers
0.0%
>100K followers
Creator vs Consumer Split
Classification based on tweet activity: Creators (>100 tweets), Consumers (10-100 tweets), Dormant (<10 tweets).
35.0%
Creators
17,524 accounts
21.0%
Consumers
10,521 accounts
43.9%
Dormant
21,955 accounts
Follower Influence Distribution
How many followers do their followers have?
Follower Account Age
How long have followers been on Twitter?
Geographic Distribution
Top locations where followers are based (from those who share location data):
196
Verified Followers
0.19% of total
13,743
Protected Accounts
13.61% of total
2 years
Avg Account Age
of their followers
Notable Followers (By Influence)
Top accounts following this user, sorted by their follower count:
| Username | Followers | Profession | Interests |
|---|---|---|---|
| @p_ma_ru | 748,759 | Illustrator | Art, YouTube, Illustration |
| @fuzichoco | 633,567 | Illustrator | Magical Mirai 2020, Character Design, Illustration |
| @curl_Q_ | 529,221 | Illustrator | illustration, adult content, novels |
| @PINKID1412 | 518,823 | YouTuber | YouTube, Instagram, Pinky |
| @la__pioggia | 510,136 | Artist | rain, water, nature |
| @kanzarinsan | 500,798 | Content creator | Vtubers, Adult Content, Offers |
| @nikumarusuisann | 345,218 | Manga artist | manga, artist, Hiroshima |
| @kusakasouji | 333,933 | Illustrator | Illustration, Fanbox, Fantia |
| @dnwls3010 | 317,800 | Illustrator | Illustration, Neo Academy, Business |
| @Pinakano | 288,642 | Musician | music, collaboration, apparel |
Top Keywords in Follower Bios
Top Hashtags in Follower Bios
55,058
Followers With Bio
45,941
Followers Without Bio
54.51%
% With Bio
45.49%
% Without Bio
Why Audience Demographics Matter
Understanding who follows an account reveals the type of influence they hold. Accounts followed primarily by users with few followers indicate broad, mainstream appeal. Those with many high-follower followers have greater potential for content amplification through secondary sharing.
Account age distribution also tells a story: a follower base with many new accounts might indicate recent viral growth, while established followers suggest long-term, stable influence. Geographic data helps understand the cultural context and timezone spread of the audience.
Buy Follower Data
Export full follower list with profile details, bios, locations, and follower counts as CSV.
Buy Followers - from $15Buy Tweet Data
Export tweets with engagement metrics, timestamps, media, and reply/retweet details as CSV.
Buy Tweets - from $15Viral Tweets
Top 5 by likes+RTs from 3,248 analyzed389,162
Combined Engagement
41,344
Total Likes
347,818
Total Retweets
77,832
Avg per Tweet
Key Metrics for Viral Tweets
0%
With Media
20%
With Hashtags
80%
With @Mentions
40%
With Links
Topical Analysis:
RT @hololivetv: #ホロライブプロ5周年✨ ホロライブプロダクション推し診断🔍 本ツイートをRTするとあなたの推しがわかるかも…❓ ※参加すると返信がきます 🔽5周年特番「ときのかけはし」をお楽しみに🔽 https://t.co/i4wgQv6odv #ホロ…
RT @hololivetv: 🎉お知らせ🎉 『Climax Story Live』の開催を記念して、RTキャンペーンを実施❗️ 『ホロライブ・サマー2022』の限定グッズを手に入れよう✨ 🔽応募方法🔽 ①本アカウントをフォロー ②本ツイートをRT 🔽詳細はコチラ🔽 htt…
本日誕生日なので 今日1日は ちょこが主役です(◦`꒳´◦)ᵎᵎ 祝ってくれてもええんやで?
RT @cover_corp: 【お知らせ】 誹謗中傷行為等に対するカバー株式会社およびANYCOLOR株式会社による連携体制の構築について https://t.co/ANJM9OldfF https://t.co/QNP1N0OWcd
RT @LaplusDarknesss: 🛸ご報告 貴様らお久しぶりです まだ最強無敵ではありませんが家族とかホロメンに支えられて少しずつ元気な心が戻ってきました これから本調子とは行きませんが少しずつ活動復帰して行こうと思います、よろしくお願いします
Key Insights & Takeaways
She leverages her VTuber persona to build a personal connection with her audience. Fan art is an important part of her engagement strategy and content creation. She uses special occasions and milestones to boost engagement and visibility.
Strengths
- + Strong engagement rates above platform average
- + Established follower base of 842,032
- + Strong original content creation
- + Active presence with consistent posting
Opportunities
- ~ Optimize posting times for peak engagement windows
- ~ Analyze top-performing content for replicable patterns
- ~ Leverage geographic concentration for targeted content
- ~ Explore collaboration potential with followed accounts
Summary
This analysis of @yuzukichococh reveals an exceptionally influential Twitter presence with 842,032 followers. The account demonstrates a content-creator strategy, averaging 2,556.4 engagements per tweet. Key strengths include consistent posting and an engaged audience, with opportunities to further optimize timing and content strategy based on the patterns identified in this report.
Need Programmatic Access?
We're building an API for developers and researchers. Get access to Twitter data programmatically for your applications and analysis.
Register Interest for API Access